
From Research Paper to Visual Story: How AI Is Changing Research Communication
A single study may need to become a poster, a presentation, a graphical abstract, and a diagram. Here is how AI-powered research visualization brings that work into one connected workflow.

A research paper can represent months or even years of work. Yet once the research is complete, researchers often face another challenge, which is explaining that work clearly to others.
A single study may need to become a conference poster, presentation, graphical abstract, summary, diagram, or infographic. Creating each of these manually can require different tools and considerable time.
Artificial intelligence is beginning to simplify this process. Instead of treating research analysis and research visualization as separate tasks, AI-powered platforms can help transform complex research into clearer and more accessible visual formats.
One platform taking this approach is ResearchViz, an AI powered research visualization platform designed to help researchers turn papers, abstracts, and research text into visual and presentation ready outputs.
Why Research Visualization Matters
Modern research produces enormous amounts of information. A single paper can contain a complex methodology, large datasets, multiple findings, and relationships between concepts that may be difficult to communicate through text alone.
Visuals can make this information easier to understand.
A research methodology can be represented as a flowchart. A literature review can become a mind map. Key findings can be summarized in a graphical abstract. A conference presentation can transform several pages of research into a structured visual narrative.
This is the basic idea behind research visualization: turning complex information into forms that are easier to understand, communicate, and remember.
ResearchViz is built around this concept, offering tools that transform research material into graphical abstracts, posters, presentations, diagrams, mind maps, infographics, and other visual formats.
What Is ResearchViz?
ResearchViz is an AI-powered platform focused on the research communication workflow.
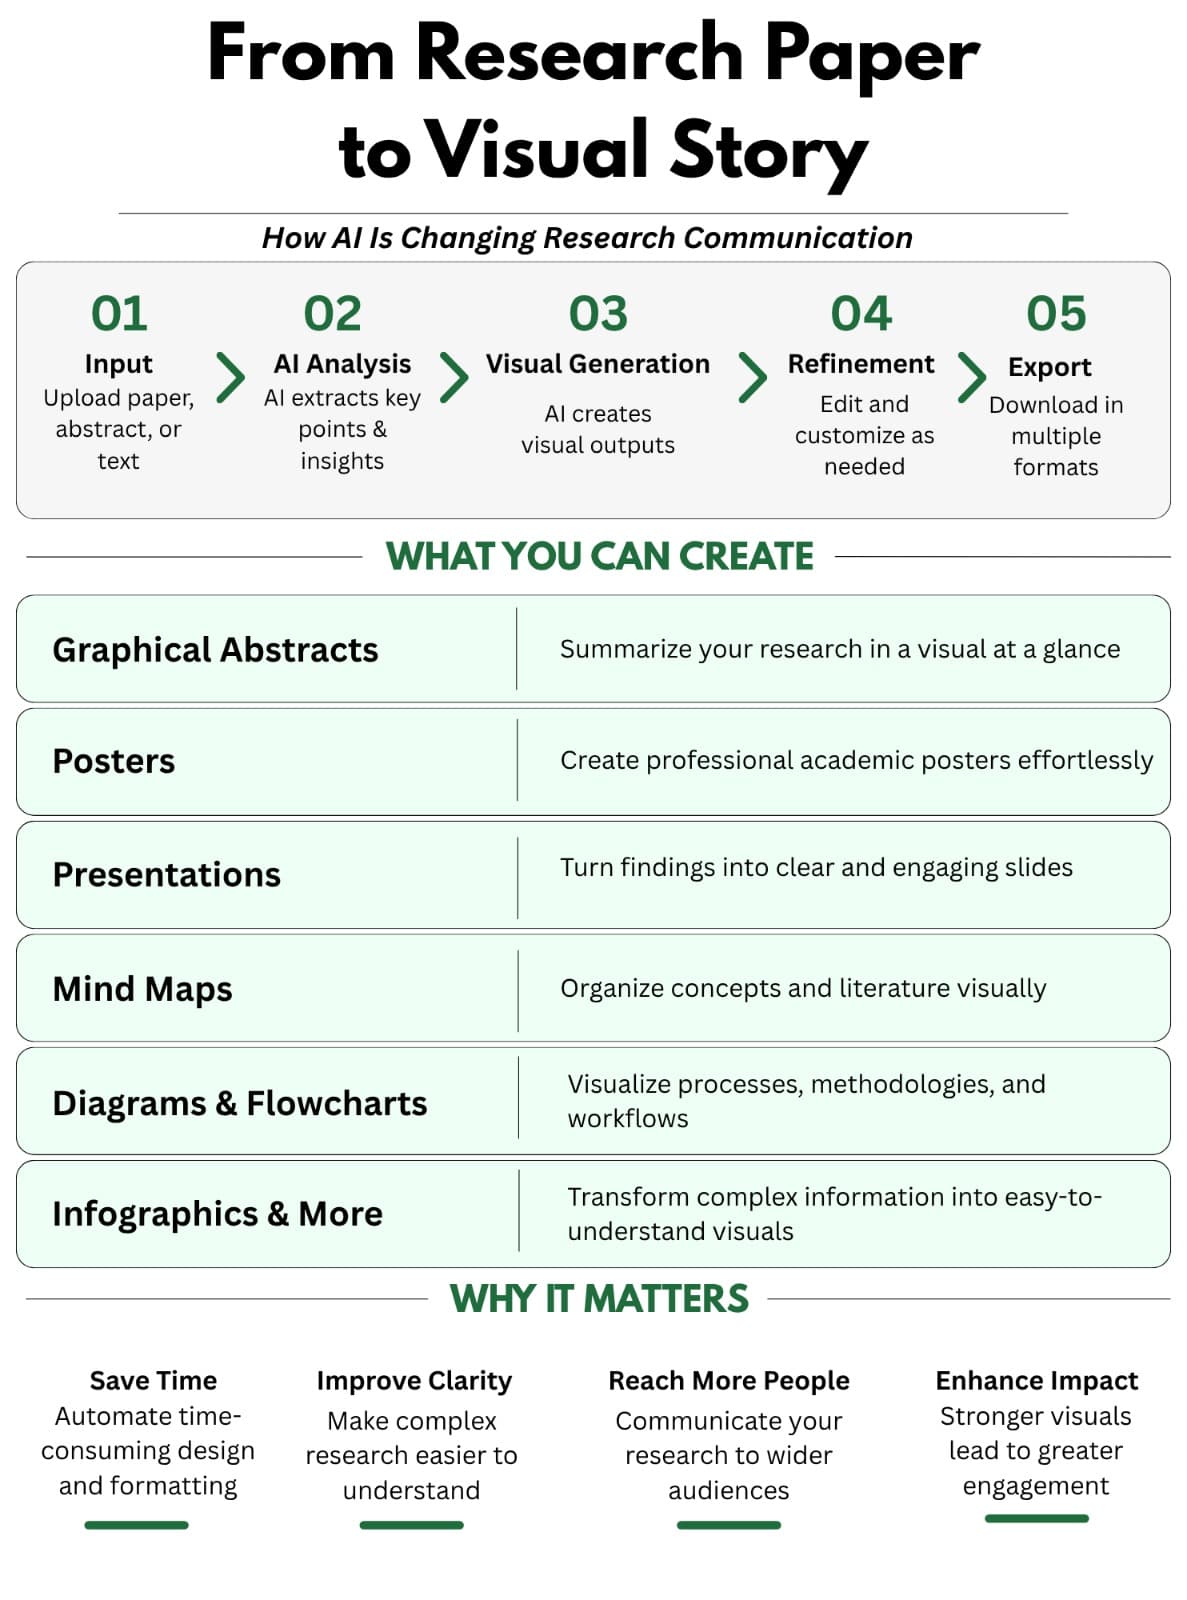
At a high level, the process can be viewed as:
Research material → AI analysis → Visual generation → Refinement → Export
Researchers can provide PDFs, abstracts, or text and use the platform to generate different research outputs. Rather than limiting users to a single type of visualization, ResearchViz provides multiple formats depending on how the information needs to be communicated.
The result is a platform designed not simply to analyze research, but to help researchers communicate it visually.
What Can You Create with ResearchViz?
ResearchViz brings several research communication tools together in one platform, allowing researchers to transform the same underlying research into different formats depending on their audience and purpose.
Graphical Abstracts
One of ResearchViz's key capabilities is graphical abstract generation. A graphical abstract presents the central message, methodology, or findings of a research study in a concise visual format, making complex information easier to understand at a glance.
ResearchViz allows users to convert research abstracts into graphical abstracts and provides different visual styles and layouts. The resulting visuals can also be exported in formats such as PNG, PDF, and PPTX, making them suitable for publications, presentations, and online communication.
Posters and Presentations
Research communication often extends beyond the paper itself. Researchers may need to prepare conference posters, journal-club presentations, or slides for academic talks, all of which require the same research to be reorganized for a different audience.
ResearchViz includes tools for generating scientific posters and presentations from research content. This can help reduce the time spent manually restructuring information and designing presentation materials.
Instead of treating each output as a separate task, researchers can think of the process as a connected workflow:
Research Paper → Key Findings → Graphical Abstract → Poster → Presentation
The research remains the same, while its format changes according to how it needs to be communicated.
Diagrams, Mind Maps, and Other Visuals
Some research is better explained through structure rather than slides or posters. ResearchViz supports visual formats such as mind maps, flowcharts, timelines, comparisons, hierarchies, processes, cycles, and lists, allowing researchers to choose a format that matches the information they are presenting.
For example, a methodology can be represented as a process diagram, a literature review can be organized as a mind map, and competing research approaches can be presented as a structured comparison. These visuals can make relationships and workflows easier to follow than text alone.
VizBoard and Text-to-Visuals
ResearchViz's VizBoard workspace provides a more flexible way to work with research content. Rather than limiting users to one predefined output, it allows them to transform text into different visual structures, experiment with templates, refine the result, and revisit previous work.
This flexibility is important because there is no single visual format that works for every research problem. The goal is to help researchers choose and create the form that communicates their work most effectively.
Together, these tools position ResearchViz not simply as a graphical abstract generator, but as a broader platform for turning research into clear, structured, and visual communication.
Who Can Benefit From ResearchViz?
ResearchViz can be useful for several groups within academia and research.
- Graduate and PhD students can use it to organize literature, prepare presentations, and create research visuals.
- Researchers and faculty can use graphical abstracts, posters, and diagrams to communicate findings.
- Conference presenters can use it to prepare posters and presentation materials.
- Interdisciplinary researchers may benefit from visual explanations when communicating technical ideas to audiences from different fields.
- Science communicators can also use research visualization to make complex findings more accessible to non-specialist audiences.
ResearchViz has already been used by more than 12,000 researchers, with thousands of papers processed and users associated with more than 140 institutions.
AI as an Assistant, Not a Replacement
AI can make research communication faster, but it does not remove the need for human judgment.
Researchers should still review AI generated content for accuracy, terminology, missing information, and potential misinterpretation before using it in academic or professional settings.
This is particularly important for scientific communication. A visually impressive graphic is only useful if it accurately represents the underlying research.
The most useful way to think about AI in this context is therefore as an assistant for research communication. It can help with speed, structure, and visual presentation while the researcher remains responsible for scientific accuracy and interpretation.
The Future of Research Communication
Research is becoming increasingly information dense. At the same time, researchers are expected to communicate their work to audiences that may have limited time and different levels of technical expertise.
This makes visual communication increasingly valuable.
ResearchViz represents one approach to this challenge by bringing research analysis and visualization into a single workflow. Instead of stopping at the research paper, the platform helps transform that research into graphical abstracts, posters, presentations, diagrams, mind maps, and other formats.
Ultimately, its value lies in bridging the gap between doing research and communicating research.
A research paper contains knowledge. Visualization gives that knowledge structure. Effective communication gives it reach.
For researchers looking to communicate complex ideas more clearly and efficiently, AI-powered research visualization represents an increasingly important part of the modern research workflow.
Start using ResearchViz
Turn your paper into a graphical abstract, poster, or presentation in minutes.
Get started